
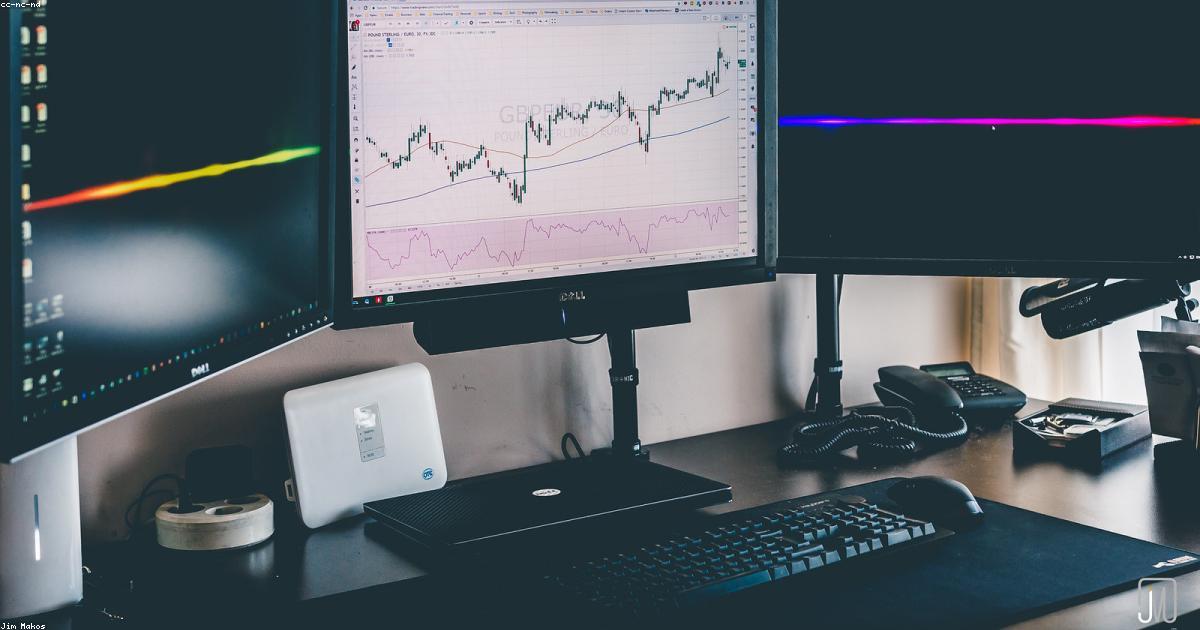
Technical analysis is the study of price action and chart patterns to anticipate future market movements. While no method predicts the market with certainty, understanding the foundational tools of technical analysis gives traders a structured framework for making decisions rather than relying on guesswork or emotion.
The Philosophy Behind Technical Analysis
Technical analysis rests on three core assumptions: that price reflects all available information, that prices move in trends, and that history tends to repeat itself because human psychology remains consistent. Rather than analyzing a company’s fundamentals, technical traders focus on what the chart reveals about the balance between buyers and sellers.
Reading Candlestick Charts
Candlestick charts are the most popular way to visualize price. Each candle shows the open, high, low, and close for a given period. The body represents the range between open and close, while the thin wicks show the extremes. Patterns such as dojis, hammers, and engulfing candles can signal potential reversals or continuations in the trend.
Support and Resistance
Support is a price level where buying interest tends to halt a decline, while resistance is where selling pressure tends to cap a rally. These zones form because traders remember past price levels and act on them. Watching how price behaves around support and resistance is one of the most practical skills a new trader can develop.
Essential Indicators
Indicators are mathematical calculations layered onto charts to clarify trends and momentum. Moving averages smooth out price to reveal direction. The Relative Strength Index measures whether an asset is overbought or oversold. The MACD highlights shifts in momentum. Used together and in moderation, these tools help confirm what price action is already suggesting.
- Moving averages for identifying trend direction.
- RSI for spotting overbought and oversold conditions.
- Volume for confirming the strength of a move.
- MACD for momentum shifts and crossovers.
Common Mistakes to Avoid
Beginners often overload their charts with dozens of indicators, leading to analysis paralysis and conflicting signals. Others ignore the broader trend and trade against it, or mistake a single pattern for a guarantee. The most successful technical traders keep their charts clean, combine signals for confirmation, and always pair their analysis with disciplined risk management.
Final Thoughts
Technical analysis is a skill that improves with screen time and deliberate practice. Start with a few reliable tools, study how they behave across different market conditions, and resist the urge to overcomplicate. Mastered patiently, technical analysis becomes a powerful lens for reading the ongoing story that every price chart tells.
 English
  German
  Polish
  French
  German (Switzerland)
  Croatian
  Czech
Czech  Italian
  Spanish
  Swedish
  Portuguese (Portugal)
  Portuguese (Brazil)
  Japanese
  Thai
Thai  Danish